
The Matrix to
Maximize Potential
A high GMTI score does not guarantee Muslim visitors, and a high share of Muslim visitors does not prove a destination is ready for them. The GMTI Performance Matrix plots both together - turning two independent measures into a single, actionable read on where a destination stands and what it should do next.
There is more
to discover than
just the score.
A GMTI score measures capability. It says a destination has built the access, communications, environment, and services a Muslim traveller needs. What it cannot say is whether any of that has translated into visitors. Two destinations can sit within a point of each other on the index and face entirely opposite problems.
The GMTI Performance Matrix resolves this by adding the second measure that the score omits: the share of a destination's international arrivals that are Muslim travellers. Read together, capability and realised demand produce four distinct strategic positions - and each one implies a different intervention, a different budget line, and a different definition of progress.
It is a diagnostic instrument, not a ranking. The point is not where a destination sits in a single edition, but which constraint is binding, and which direction it needs to move across the next several.
Supply on one axis.
Demand on the other.
GMTI Score
The horizontal axis is the destination's GMTI score - its measured capability across access, communications, environment, and services. It answers a question about supply: has this destination built the infrastructure a Muslim traveller needs?
Muslim Arrival Share
The vertical axis is the share of a destination's total international arrivals that are Muslim travellers. It answers a question about demand: has that capability actually converted into visitors, or is the market going elsewhere?
Same market.
Four entirely
different problems.
Select a quadrant to read what the position means and what it implies for strategy.
Trailblazers
These destinations have both high GMTI scores and a high proportion of Muslim arrivals, indicating a strong and sustained commitment to Muslim-friendly services and facilities. Supply and demand reinforce each other: investment in services attracts arrivals, and those arrivals justify further investment.
Defend the position. The risk here is not underperformance but complacency - and the rest of the matrix is moving.
Every destination
resolves to a position.
Each point is a destination, placed by its GMTI score and its Muslim arrival share.
Swipe to explore
Full size (opens the chart image in a new tab)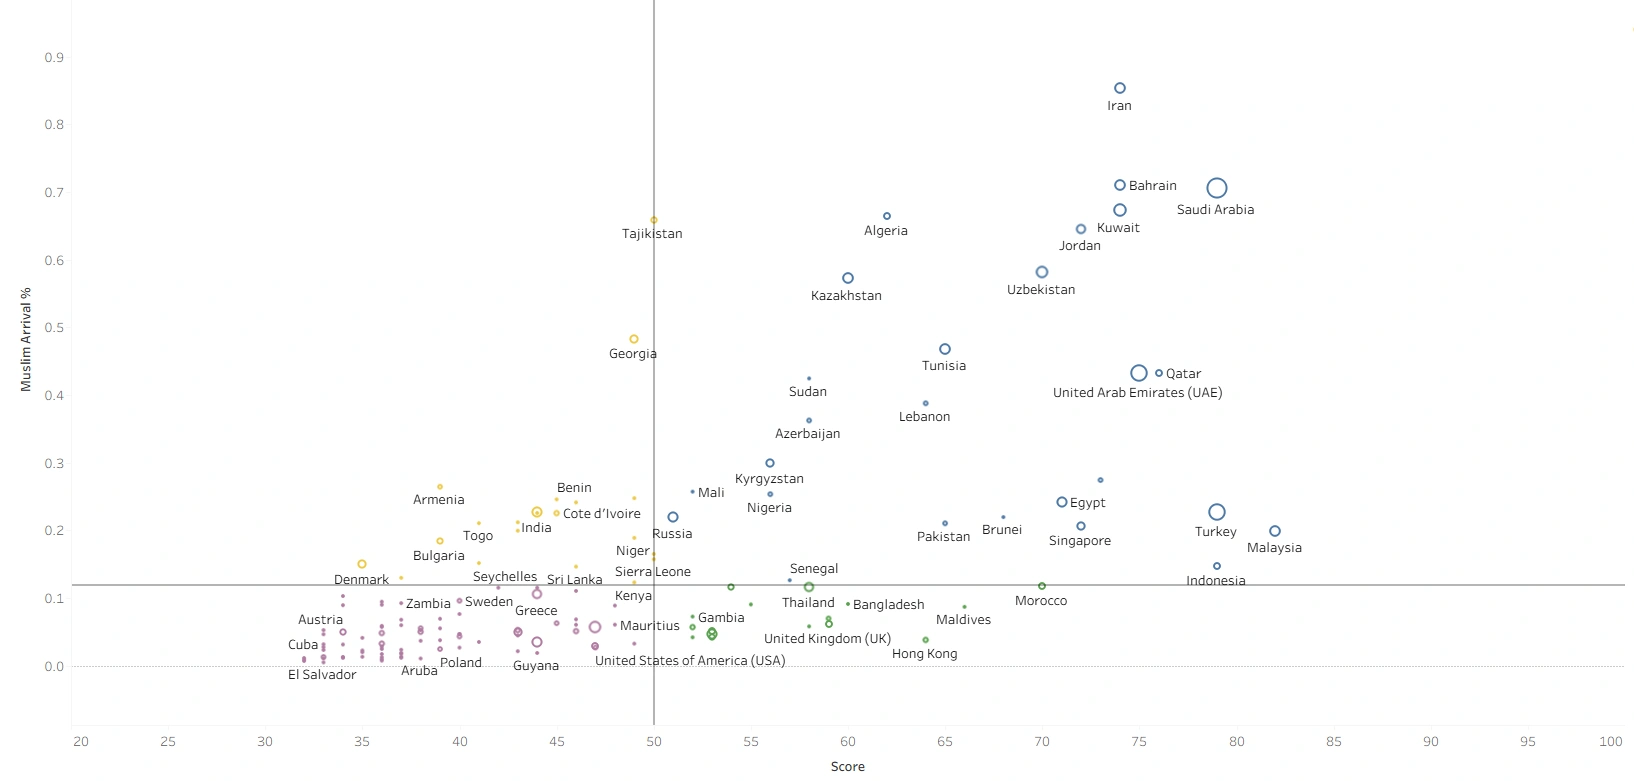
150 destinations plotted. Quadrants split at a GMTI score of 50 and a Muslim arrival share of 12%.
A position is a
diagnosis, not
a verdict.
- 01
Locate the position, not the rank
The matrix is not a league table. A destination in Untapped Potential is not failing - it is at a different stage, facing a different constraint, and needs a different intervention than one in Potential Leaders.
- 02
Read the constraint the quadrant implies
Each position isolates what is actually holding a destination back. High score with low arrivals is a communications problem. High arrivals with a low score is a services problem. Treating one as the other wastes the budget.
- 03
Plan the movement, not the label
The value of the matrix is directional. Emerging destinations move right by building services. Potential Leaders move up by converting awareness. The target is a vector across editions, not a quadrant to sit in.
- 04
Track the shift across GMTI editions
Because the axes are stable year to year, position is comparable across editions. A destination can measure whether an investment actually moved it - and in which direction - rather than relying on a single annual score.
Because both axes are stable across editions, the matrix supports longitudinal comparison. The strategic question is never simply which quadrant a destination occupies today - it is how far, and in which direction, it has moved since the last index.
One matrix, read differently
by every stakeholder.
National tourism organizations
Establish where the destination sits, which of the two constraints is binding, and what the realistic next quadrant is over a three-to-five year horizon.
Hotels and hospitality groups
Read the quadrant of every market you operate in. Service investment in an Emerging destination and marketing investment in a Potential Leader are not interchangeable.
Airlines and transport operators
Identify where Muslim arrival share is running ahead of destination readiness - those routes carry demand the destination is not yet equipped to convert into repeat travel.
Destination marketing agencies
Potential Leaders are the clearest brief in the matrix: the product is already built, and the gap is positioning, awareness, and distribution into Muslim source markets.
Investors and developers
Use quadrant movement across GMTI editions to distinguish destinations with genuine trajectory from those holding a static position.
Researchers and analysts
A reproducible two-axis frame for comparing supply-side readiness against realised demand across 150 destinations and multiple index years.
The matrix measures
what the frameworks
produce.
The GMTI Performance Matrix is a diagnostic layer, not a standalone method. It reports the outcome of work done through CrescentRating's underlying frameworks - and points back to whichever one addresses the constraint it has surfaced.
The four pillars that produce the GMTI score on the horizontal axis
How a destination converts readiness into an experience worth travelling for
The unified system the matrix ultimately measures the output of
Find out which
constraint is actually
binding.
Work with CrescentRating to position your destination on the GMTI Performance Matrix, identify the constraint holding it in place, and build the sequenced plan that moves it - backed by 18years of research and the GMTI's global dataset of 150 destinations.